Data Visualization

We work to make your data stand out.

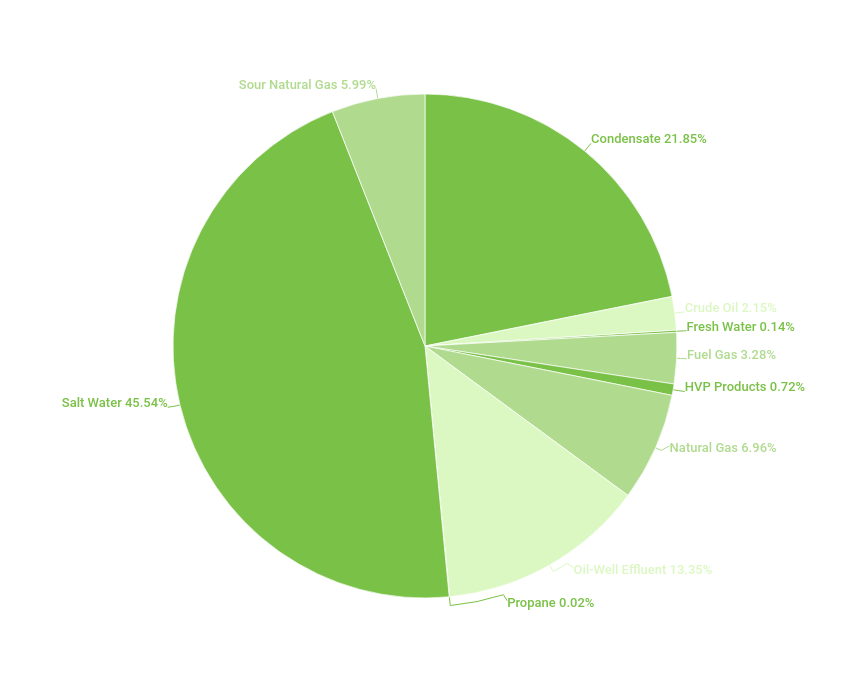
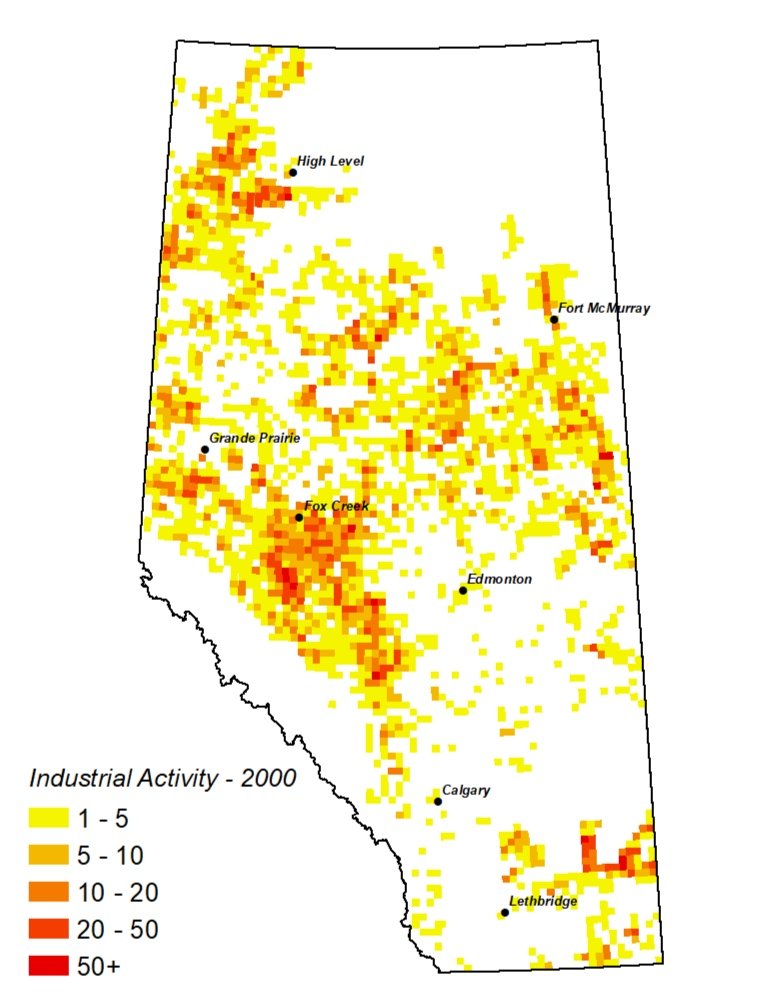
When you have to represent complex datasets, whether it’s maps, tables, charts, or an combination of different visualizations, our GIS and design teams can help create data visualizations that represent your data in a way that is easy to understand — furthering its impact.
We work with a number of different platforms including ArcGIS, Power BI, Adobe Illustrator, and SPSS to analyze and distill your data to create custom visualizations to improve communications with your stakeholders.